Device status
This modal (also referred to as a window or dialog) is a configurable dashboard where "panels" with specialised information can be arranged in columns.
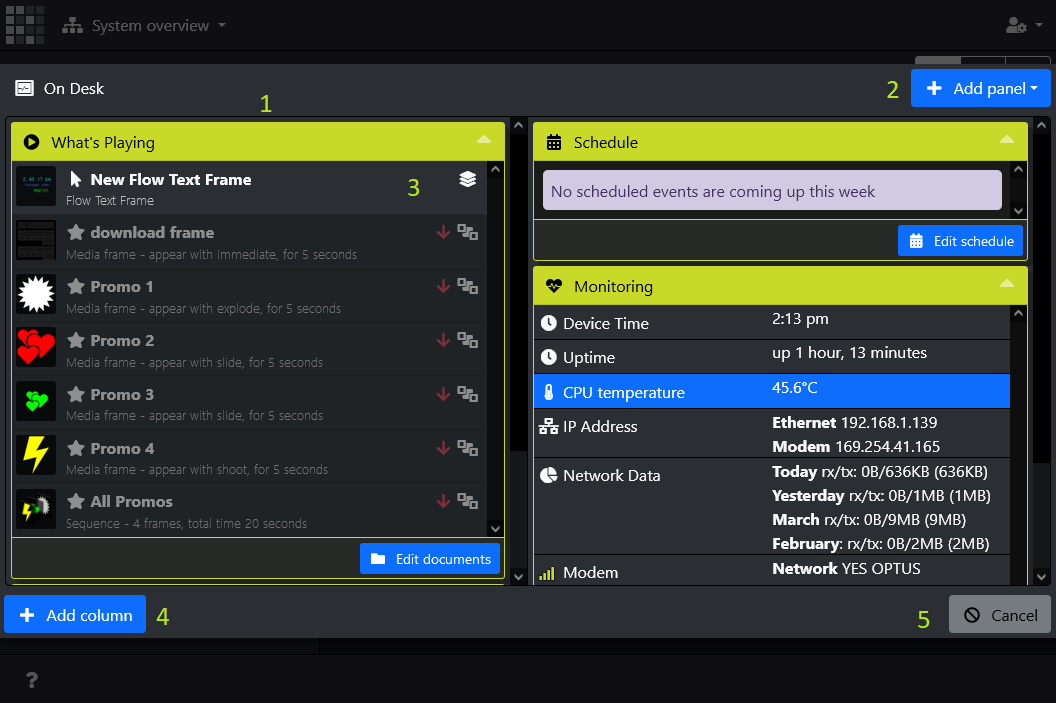
- On larger displays (i.e. desktops), panels can be arranged into 1-5 columns. On mobile displays, all columns are collapsed into a single column.
-
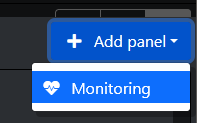
To add a panel, select from this dropdown box. Only one of each panel type can be added.
-
Each panel consists of a header, which when clicked will collapse or expand the panel, panel-specific content, and in some cases a footer containing tools specific to that panel.To rearrange a panel, left-click and drag the panel from the header bar to move to a different column.
- To add a column to the display, click this button. Up to 5 columns can be displayed.
-
To remove a panel, right-click the header bar of a panel and select "Remove panel":

Available device status panels
What's Playing
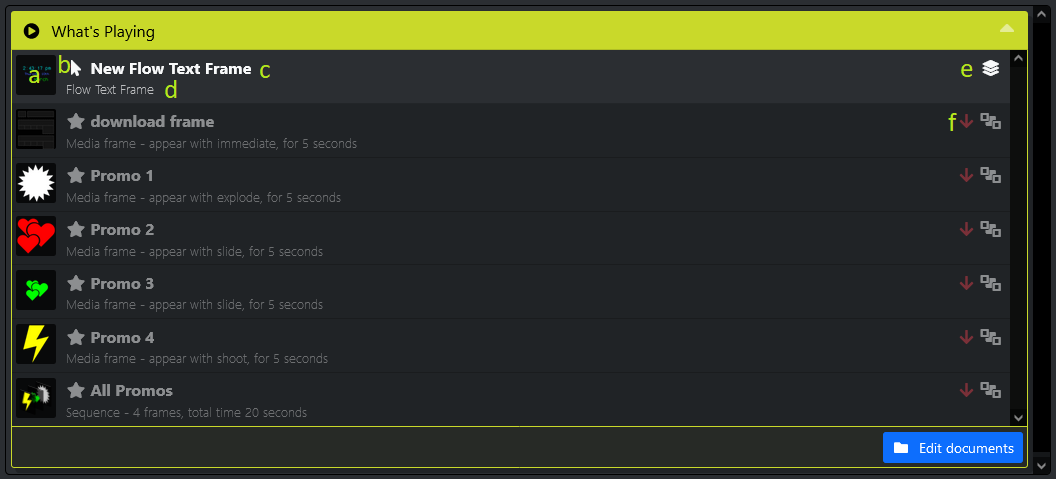
This panel indicates what documents are registered for display on the device.
- The document thumbnail appears here
- An icon indicating the display "context" (manual, schedule, script, application or emergency)
- The document title appears here
- The document description appears here
- The document priority (low, normal, high, application or emergency)
- Documents that are registered for display but are pre-empted by higher priority documents will appear greyed out, with a red icon.
To edit documents for the selected device, click "Edit documents".
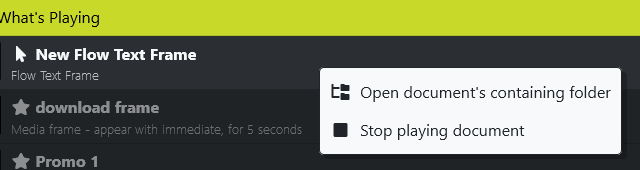
Right-click or long-tap a document to show actions available for the selected document:
Schedule
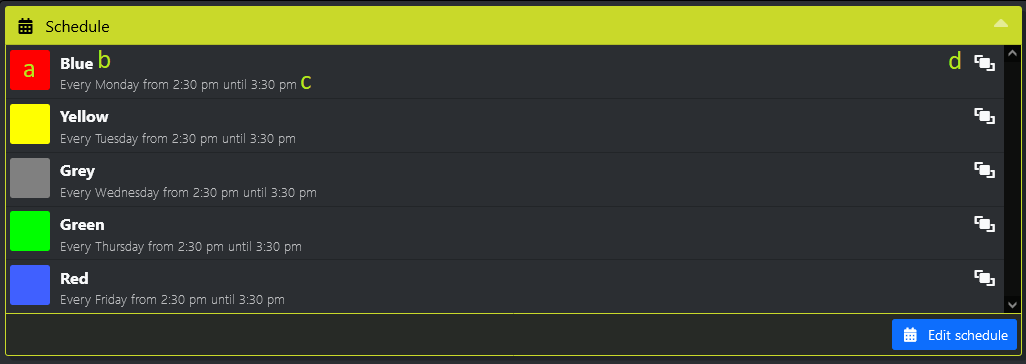
This panel displays documents that are scheduled to appear within the next week, in order of their next appearance.
- The scheduled document's thumbnail appears here
- The scheduled document's title appears here
- A description of the schedule appears here
- The display priority appears here
To edit schedules for the selected device, click "Edit schedule".
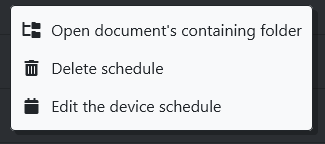
Right-click or long-tap a schedule to show actions available for the selected schedule:
Active Scripts
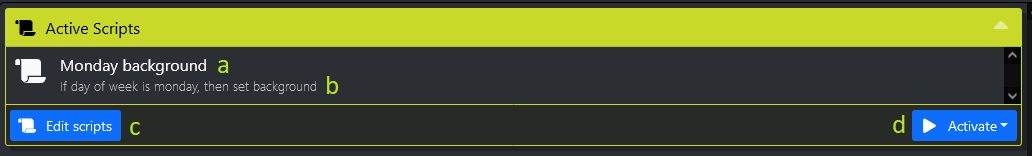
This panel displays scripts that are currently activated, and allows manually-activated scripts to be triggered.
- An active script's title is displayed here
- A description of the script's functionality is displayed here
- Click "edit scripts" to edit the scripts for the selected device
-
If there are any manually-activated scripts, select a script from this dropdown to activate it:

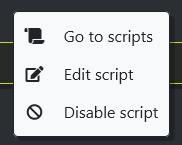
Right-click or long-tap a script to show actions available:
Monitoring
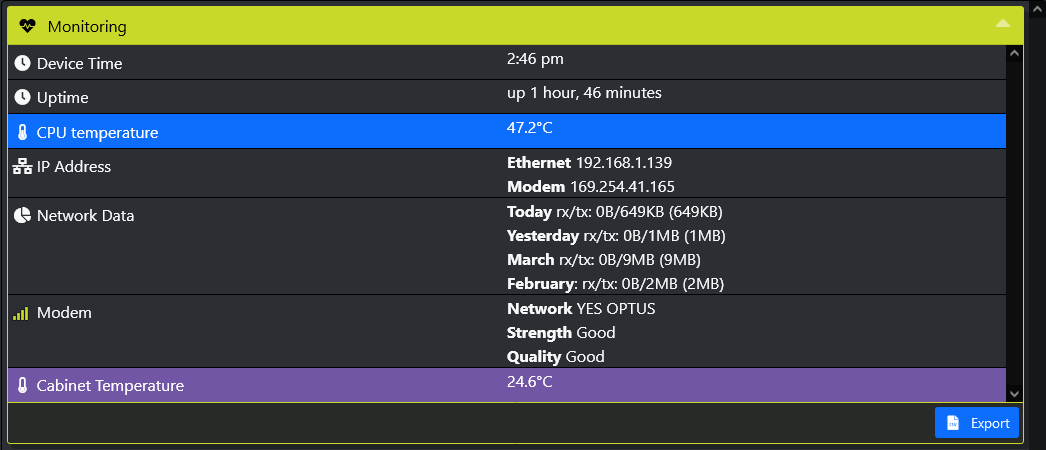
This panel displays the most recently available sensor readings, system configuration, and miscellaneous monitoring information for the selected device.
Depending on the hardware installed and the device modules available, different monitoring information is made available.
Click "Export" to download the monitoring table as a CSV spreadsheet file.